
Updated April 2026
Your restaurant is humming with energy. Every table is booked. Servers are hustling between the dining room and the kitchen, where it's a hotbed of activity and noise. Tickets are flying through the POS system.
Business looks great, but the numbers don't add up. Many restaurant operators face the same trap: full dining rooms with little profit to show for it.
Are You Managing Percentages or Banking Dollars?
A restaurant with a packed dining room can still fail. Sometimes, you can find incredible success with fewer covers and the right mix of dishes. Managing profitability by percentages alone can hide the truth about which menu items are helping you make more money.
How do you know what will work? Here's the secret: Stop relying only on food cost percentage (FCP) without also looking at contribution margin (CM).
Food cost percentage tells you how much of each dollar goes toward food costs. Your restaurant's contribution margin tells you how many dollars land in your bank account after ingredients are paid for. One is a percentage; the other is cold, hard cash.
You can look at both contribution margin and food cost percentage for total food sales, over a specific time period, or for a particular item—especially when you use the advanced menu analytics included with menu engineering tools from meez. Together, these metrics tell the real story of your restaurant’s profitability.
That tension between what the numbers say and what the business actually needs played out in real time at Ample Hills Creamery, the beloved Brooklyn ice cream brand. Co-founder Brian Smith, a guest on the meez Podcast, built one of New York's most successful dessert concepts without a food background — and learned the hard way that food cost percentage alone doesn't tell the whole story.
"Our goal was always to try to get it around 30%. But we were often pushing 35% because we were buying the best ingredients — the best cream, the best eggs. Maybe 75% of your audience isn't gonna tell the difference. But the 25% that can are gonna be the ones that are your brand ambassadors." — Brian Smith, Co-Founder, Ample Hills Creamery
That perspective shapes everything that follows. The goal isn't the lowest possible food cost percentage — it's knowing exactly what every dish costs, what it contributes, and whether those numbers support your business.
A Tale of Two Metrics: Key Formulas & Examples
It’s important to know how to calculate food cost percentage and contribution margin before you start making strategic decisions based on the metrics. When you see where the numbers come from, you’ll better understand what they mean for your menu.
The Food Cost Percentage Formula Explained
Food cost percentage tells you what share of sales revenue is eaten up by ingredients. You can calculate food cost percentage by dish for menu engineering, by category to spot trends in customer choices, and for the restaurant’s P&L statement.
To calculate food cost percentage, you need to know your Cost of Goods Sold (COGS). For a restaurant, COGS includes:
- Direct ingredients (proteins, vegetables, grains, dairy)
- Spices, oils, garnishes
- Disposables tied directly to the dish (like takeout containers)
COGS does not include:
- Labor costs
- Fixed costs like rent and utilities
- Other variable costs like marketing or administrative expenses
How to Calculate Food Cost Percentage
The formula for calculating food cost percentage (FCP) is:
Food Cost Percentage (FCP) = (COGS Selling Price) x 100
Many restaurants treat food cost percentage as their north star. And while it’s important to understand and manage your food costs, here’s the tricky part: A dish with a 20% food cost percentage might seem fantastic. But when 20% only amounts to $4 per plate, is it enough to cover your labor, rent, and everything else it takes to run a restaurant?
What Is the Ideal Food Cost Percentage?
The most commonly cited benchmark: an ideal food cost percentage for most full-service restaurants falls between 28–35%. That range holds across decades of industry data — and real operators confirm it.
But it isn't a law. Brian Smith's experience at Ample Hills is instructive for any operator wondering whether it's okay to run above 30%:
"You could make ice cream with heavy cream that costs $80 for a five-gallon bag, or you can pay $120 for a five-gallon bag. The 25% of customers that can tell the difference are the ones that become your brand ambassadors." — Brian Smith, Co-Founder, Ample Hills Creamery
The lesson: food cost percentage is a target range, not a ceiling. Running at 33–35% on purpose because your concept demands premium inputs — is a legitimate strategy, as long as your contribution margin and overall P&L support it. Running at 33–35% by accident, because you don't have accurate recipe costs, is a problem.
How to Calculate a Restaurant’s Contribution Margin
While food cost percentage is about ratios, contribution margin is about cash. It tells you how many dollars a dish contributes after covering food costs.
The formula for calculating contribution margin for a food item or restaurant is:
Contribution Margin (CM) = Selling Price – COGS
Think of contribution margin as your operating fund. The dollars available to cover:
- Fixed costs: rent, mortgage, insurance, licenses
- Labor costs: chef salary, line cooks, front-of-house wages
- Operating expenses: utilities, marketing, maintenance, POS systems
A dish with a low food cost percentage that also has a low contribution margin may fail to cover expenses adequately. A higher contribution margin can mean a higher cash flow.
Example: Calculating Contribution Margin
Margherita Pizza, Menu Price $18.00
COGS Breakdown:
- 10oz Dough Ball: $0.75
- 4oz Tomato Sauce: $0.60
- 3oz Fresh Mozzarella: $2.10
- 2 Basil Leaves: $0.30
- 1oz Olive Oil: $0.25
Total Food Cost: $4.00
Contribution Margin: $18.00 − $4.00 = $14.00
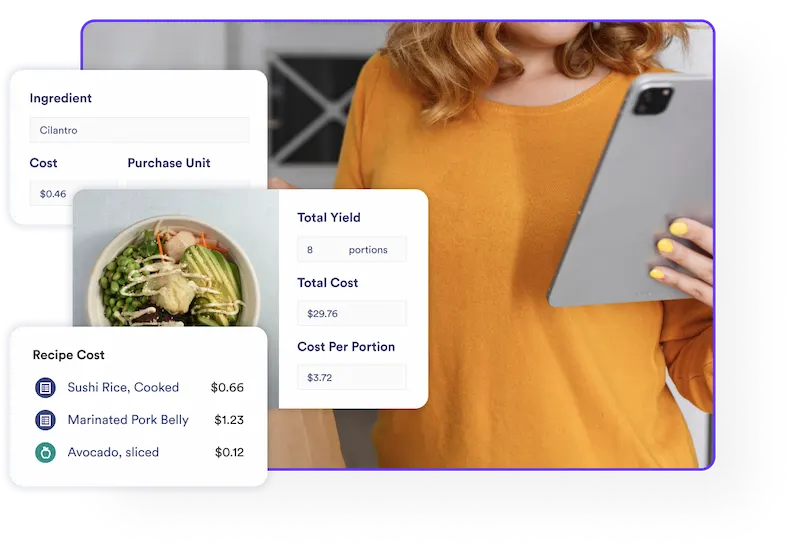
Every pizza sold puts $14 in your operating budget. The math looks simple, but you know these numbers can change often. This is where meez simplifies the process, updating COGS in real time and showing you the impact on contribution margin without manual recalculations.
Pro chef tip: Contribution margin gives you a dollar value you can plan with. Make sure this dollar value is accurate every time by getting your food costs right.
Food Cost Percentage vs. Contribution Margin Example: The Steak vs. The Pasta
Comparing two dishes side by side makes it clear why both food cost percentage and contribution margin matter.

At first glance, the pasta looks like a high performer because of its lower food cost percentage. But let’s run the numbers across a month of sales. If guests order 500 of each dish:
- Steak Gross Profit: 500 × $24 = $12,000
- Pasta Gross Profit: 500 × $16.50 = $8,250
That’s $4,250 in favor of the steak. This demonstrates how contribution margin uncovers insights that food cost percentage alone can’t provide.
Now imagine you want to promote one of these dishes in an email blast. Based on this data, should you choose the pasta or the steak? A short-term boost in steak sales could add thousands in gross profit over the course of a week if you can execute consistently. Promoting the pasta could make the dining room look busy without a lot in the bank.
Comparing dishes in this way can be time-consuming and error-prone. meez simplifies side-by-side menu analysis and allows you to see how small changes impact profitability across your menu.
When to Use Contribution Margin: How to Price a Restaurant Menu for Maximum Profit in 2026
Contribution margin becomes especially powerful when you use it to help drive menu pricing and profitability strategy.
Moving Beyond Cost-Plus: Profit-Driven Pricing
Traditionally, restaurants have priced items using a markup formula: total food cost × multiplier. But today’s restaurant operators are embracing profit-driven pricing, which considers speed and throughput as much as raw margins.
One way to approach profit-driven pricing is by calculating contribution margin per minute. Contribution margin per minute measures profitability relative to prep and cook time, helping you evaluate labor efficiency. Here’s an example:
- Ribeye Steak: $24 CM ÷ 15 minutes = $1.60 per labor minute
- Pasta Alfredo: $16.50 CM ÷ 4 minutes = $4.12 per labor minute
From a labor efficiency standpoint, pasta wins. Even with a lower contribution margin, it drives more profit per unit of time, which is a critical lens for busy kitchens. This type of analysis helps culinary professionals and kitchens find a balance between premium items that take longer to prepare and fast-turn dishes that keep cash flowing.
This kind of thinking — optimizing for contribution, not just cost ratio — is exactly what leads operators to unexpected conclusions about their most profitable items. Brian Smith at Ample Hills discovered his highest-margin flavor wasn't the flashiest one on the menu:
"Sweet as Honey was really good because it didn't take much honey to make honeycomb, and it didn't have vanilla in it, which is expensive. The base was sweet cream. And that flavor was very popular." — Brian Smith, Co-Founder, Ample Hills Creamery
Low-cost base, high selling price, strong volume — that's contribution margin thinking in practice. It's the same logic operators use when they find that a well-priced pasta or a simple roast chicken outperforms a premium protein on the P&L.
Seasonal Menus and Contribution Margin
Contribution margin is also useful when planning seasonal menus. Suppose you’re creating a summer menu with heirloom tomatoes and local seafood—seasonal ingredients that might push your food cost percentage higher. But if guests are willing to pay a premium, your contribution margins could make up for it. Looking at the dollar contribution helps you determine whether the seasonal investment is worthwhile.
The same applies to limited-time promotions and special events. A monthly burger special may use toppings that increase the food cost percentage, but if it generates $10 or more per sale, it might be worth featuring to keep your menu fresh and exciting. Similarly, a unique prix fixe menu for Valentine’s Day might include specialty dessert items and a food cost percentage that looks high on paper. But if each table guarantees $150 in contribution margin, the event can still be a major win. Contribution margin helps you plan these scenarios with confidence.
Identifying and Fixing Low-Performing Dishes
When you categorize your dishes using the menu engineering matrix, a dish with a high contribution margin but low popularity is referred to as a Puzzle.
Solve the Puzzles on your restaurant’s menu with:
- Sensory language in descriptions of dishes
- Social media features with professional photography
- Server incentives for upselling
- Sample portions for regulars
From Data to Menu Design & Menu Psychology
Once you know your high-contribution margin items, you can design your menu to highlight them. Proven tactics include:
- Placing them in the “golden triangle” (top-right of a two-page menu)
- Using callout boxes or icons
- Employing descriptive, story-driven language to increase perceived value
Pro chef tip: Highlighting the right dishes depends on more than intuition. Tools like meez let you quickly spot Puzzles, experiment with adjustments, and see how each change impacts profitability.
The Holistic View: Mastering Your Menu’s Financial Story
Now that you know the “secret” to truly understanding your restaurant’s profitability—looking at more than one metric—what’s next? It’s time to unlock the power of all your data.
Profitability (CM) Meets Popularity (Sales Data)
Most POS systems provide sales data on your menu items. Combining sales data with contribution margin is where popularity meets profitability. That data duo is a powerhouse when it comes to making decisions that can supercharge your restaurant’s profitability.
Think of your menu like a live concert lineup. Contribution margin is the money you make on each ticket, while sales data shows the size of your audience. The most profitable items are your “headliners”—the high-margin dishes that are also guest favorites.
Pro chef tip: A great band playing to an empty room won’t generate any profit, but a mediocre act with a massive crowd won’t bring you repeat business. The true winners have talent and play to packed houses. Popular and profitable, just like Stars on the menu engineering matrix. For the full menu engineering matrix and framework for plotting Stars, Plowhorses, Puzzles, and Dogs, check out The Definitive Guide to Menu Engineering.
The Number Behind the Numbers: Recipe Consistency
There's a dimension of contribution margin that rarely gets discussed: it only holds up if your team executes recipes consistently. A dish engineered to deliver $16.50 in contribution margin delivers that number when it's made to standard — not when someone is over-portioning the protein or improvising on ingredients.
Brian Smith ran into this exact challenge as Ample Hills scaled beyond a single shop:
"It's very hard to say this flavor gets exactly three cups of cookie dough mixed into it — because you're mixing it in as you're going, trying to get the layers right. It's not a machine doing it, it's a person. You might pull it a little sooner, a little later, it gets a little thicker. Those were all learnings that had to happen over time." — Brian Smith, Co-Founder, Ample Hills Creamery
Every degree of inconsistency erodes your theoretical contribution margin. The gap between what a dish should contribute and what it actually contributes — across hundreds of covers a week — is where profit quietly disappears. Standardized, accurate recipes tied to live ingredient costs are what close that gap.
Balancing Metrics with Guest Experience & Customer Satisfaction
Data can be a business owner’s best friend, but numbers alone can lead you astray. One restaurant subbed frozen fries for their hand-cut favorites to improve a burger plate’s contribution margin by $0.75. The restaurant’s food cost improved in the short term, but it came at a price. Online reviews started mentioning “generic, soggy fries,” and repeat visits dropped by 10%.
The lesson: In the pursuit of profitability, don’t kill popularity.
Brian Smith articulated this balance from the other direction — he ran above his food cost target deliberately, because the quality of ingredients was load-bearing for the brand:
"You could make ice cream with the cheaper cream, and maybe 75% of your audience won't tell the difference. But the 25% that can are going to be the ones who are your brand ambassadors." — Brian Smith, Co-Founder, Ample Hills Creamery
The principle holds for any concept. Optimizing for contribution margin and food cost percentage has a ceiling — the point where further cuts start costing you guests. Know where that ceiling is before you start pulling levers.
Stop Choosing: How a Culinary OS Tracks Both Metrics Effortlessly
Most restaurant operators don’t have the time to run endless calculations. That’s when technology makes all the difference.
The Pitfalls of Manually Tracking Food Costs
Manually tracking food cost percentage and contribution margin has major pitfalls:
- Version control headaches with spreadsheets
- High risk of errors from broken formulas
- Hours of manual entry for vendor pricing and recipe maintenance
- Communication gaps between BOH and FOH teams
Does this sound familiar? Chef updates a recipe with new vendor pricing, but FOH is still using an outdated spreadsheet. The result? The kitchen estimates a dish’s contribution margin at $14, while the manager promotes it based on a $17 margin. Misalignment like this erodes trust and leads to poor decisions.
A single mis-typed formula in a spreadsheet can throw off food cost percentage and contribution margin calculations for an entire menu category. By the time someone notices, weeks of decisions may have been made based on faulty data.
The Case for Automation
Savvy culinary pros are adopting platforms that centralize recipe data, update costs in real time, and calculate both food cost percentage and CM automatically. With a single source of truth, restaurant businesses can minimize errors, reduce food waste, and ensure every decision is informed by accurate data.
Automated systems also help with forecasting. When every ingredient cost and recipe is linked, operators can quickly see the impact of price changes. If avocados spike by 20%, you immediately see how that affects not only guacamole but every dish that uses avocado oil or features avocado as a garnish. That visibility is impossible to achieve consistently with spreadsheets, but meez has revolutionized the culinary space by offering it in a real-time digital platform.
Linking Cost Control to Profitability
Conclusion: The New Rules of Restaurant Profitability
In 2026, the most profitable restaurants aren’t chasing one number. They’re looking at the full picture. The new rules are simple:
- Track food cost percentage for high-level budget control
- Use contribution margin for ground-level profit strategy
- Explore profit-driven pricing
- Protect guest satisfaction while optimizing margins
The true masters then combine contribution margin with sales data to optimize their menus and grow restaurant profits—and they automate it all with meez’s menu engineering and insights tool.
Frequently Asked Questions (FAQ)
Why is my steak dinner not profitable despite a high price?
There are two likely reasons: 1) The menu item has a low contribution margin, meaning the total food costs are too high, leaving you with very few dollars per sale, or 2) It has a low sales velocity, meaning it has a healthy contribution margin but isn’t selling enough. Try lowering food costs without compromising quality and guest satisfaction or explore tactics to increase sales.
Should I remove all dishes with low contribution margins from my restaurant’s menu?
Not necessarily. Menu options with low contribution margins but high volume (aka Plowhorses on the menu engineering matrix) still drive revenue. Adjust portion sizes or pair them with high-margin items instead.
How do food cost percentage and contribution margin apply to my bar program?
The principles for bar programs are the same as those for food. Bars usually have lower food cost percentages (18–24%) but higher contribution margins. For example, a glass of wine might have a 25% FCP, and a steak a 40% FCP; however, the steak's dollar contribution margin is likely much higher. It's important to analyze both food and beverage contribution margin separately to understand where your true profit centers are.
What is a good food cost percentage in 2025?
The industry average for food cost percentage is still 28–35%, but inflation and supply chain issues have contributed to fluctuations. In 2026, restaurants should focus less on a single percentage. Instead, set a target contribution margin for each menu item and ensure your prime cost is in a healthy range.
What is the difference between food cost percentage and contribution margin?
Food cost percentage shows the share of sales spent on food costs. Contribution margin shows the actual dollars left after food costs.
How do I calculate contribution margin for a menu item?
Subtract the food cost (COGS) for the dish from the selling price. The result is the contribution margin in dollars.
Why does food cost percentage matter if contribution margin shows dollars?
Because food cost percentage provides context for efficiency across the menu. Used with contribution margin, it shows both the ratio of food cost to profit and the dollars left to cover expenses.
Heading 1
Heading 2
Heading 3
Heading 4
Heading 5
Heading 6
Lorem ipsum dolor sit amet, consectetur adipiscing elit, sed do eiusmod tempor incididunt ut labore et dolore magna aliqua. Ut enim ad minim veniam, quis nostrud exercitation ullamco laboris nisi ut aliquip ex ea commodo consequat. Duis aute irure dolor in reprehenderit in voluptate velit esse cillum dolore eu fugiat nulla pariatur.
Block quote
Ordered list
- Item 1
- Item 2
- Item 3
Unordered list
- Item A
- Item B
- Item C
Bold text
Emphasis
Superscript
Subscript