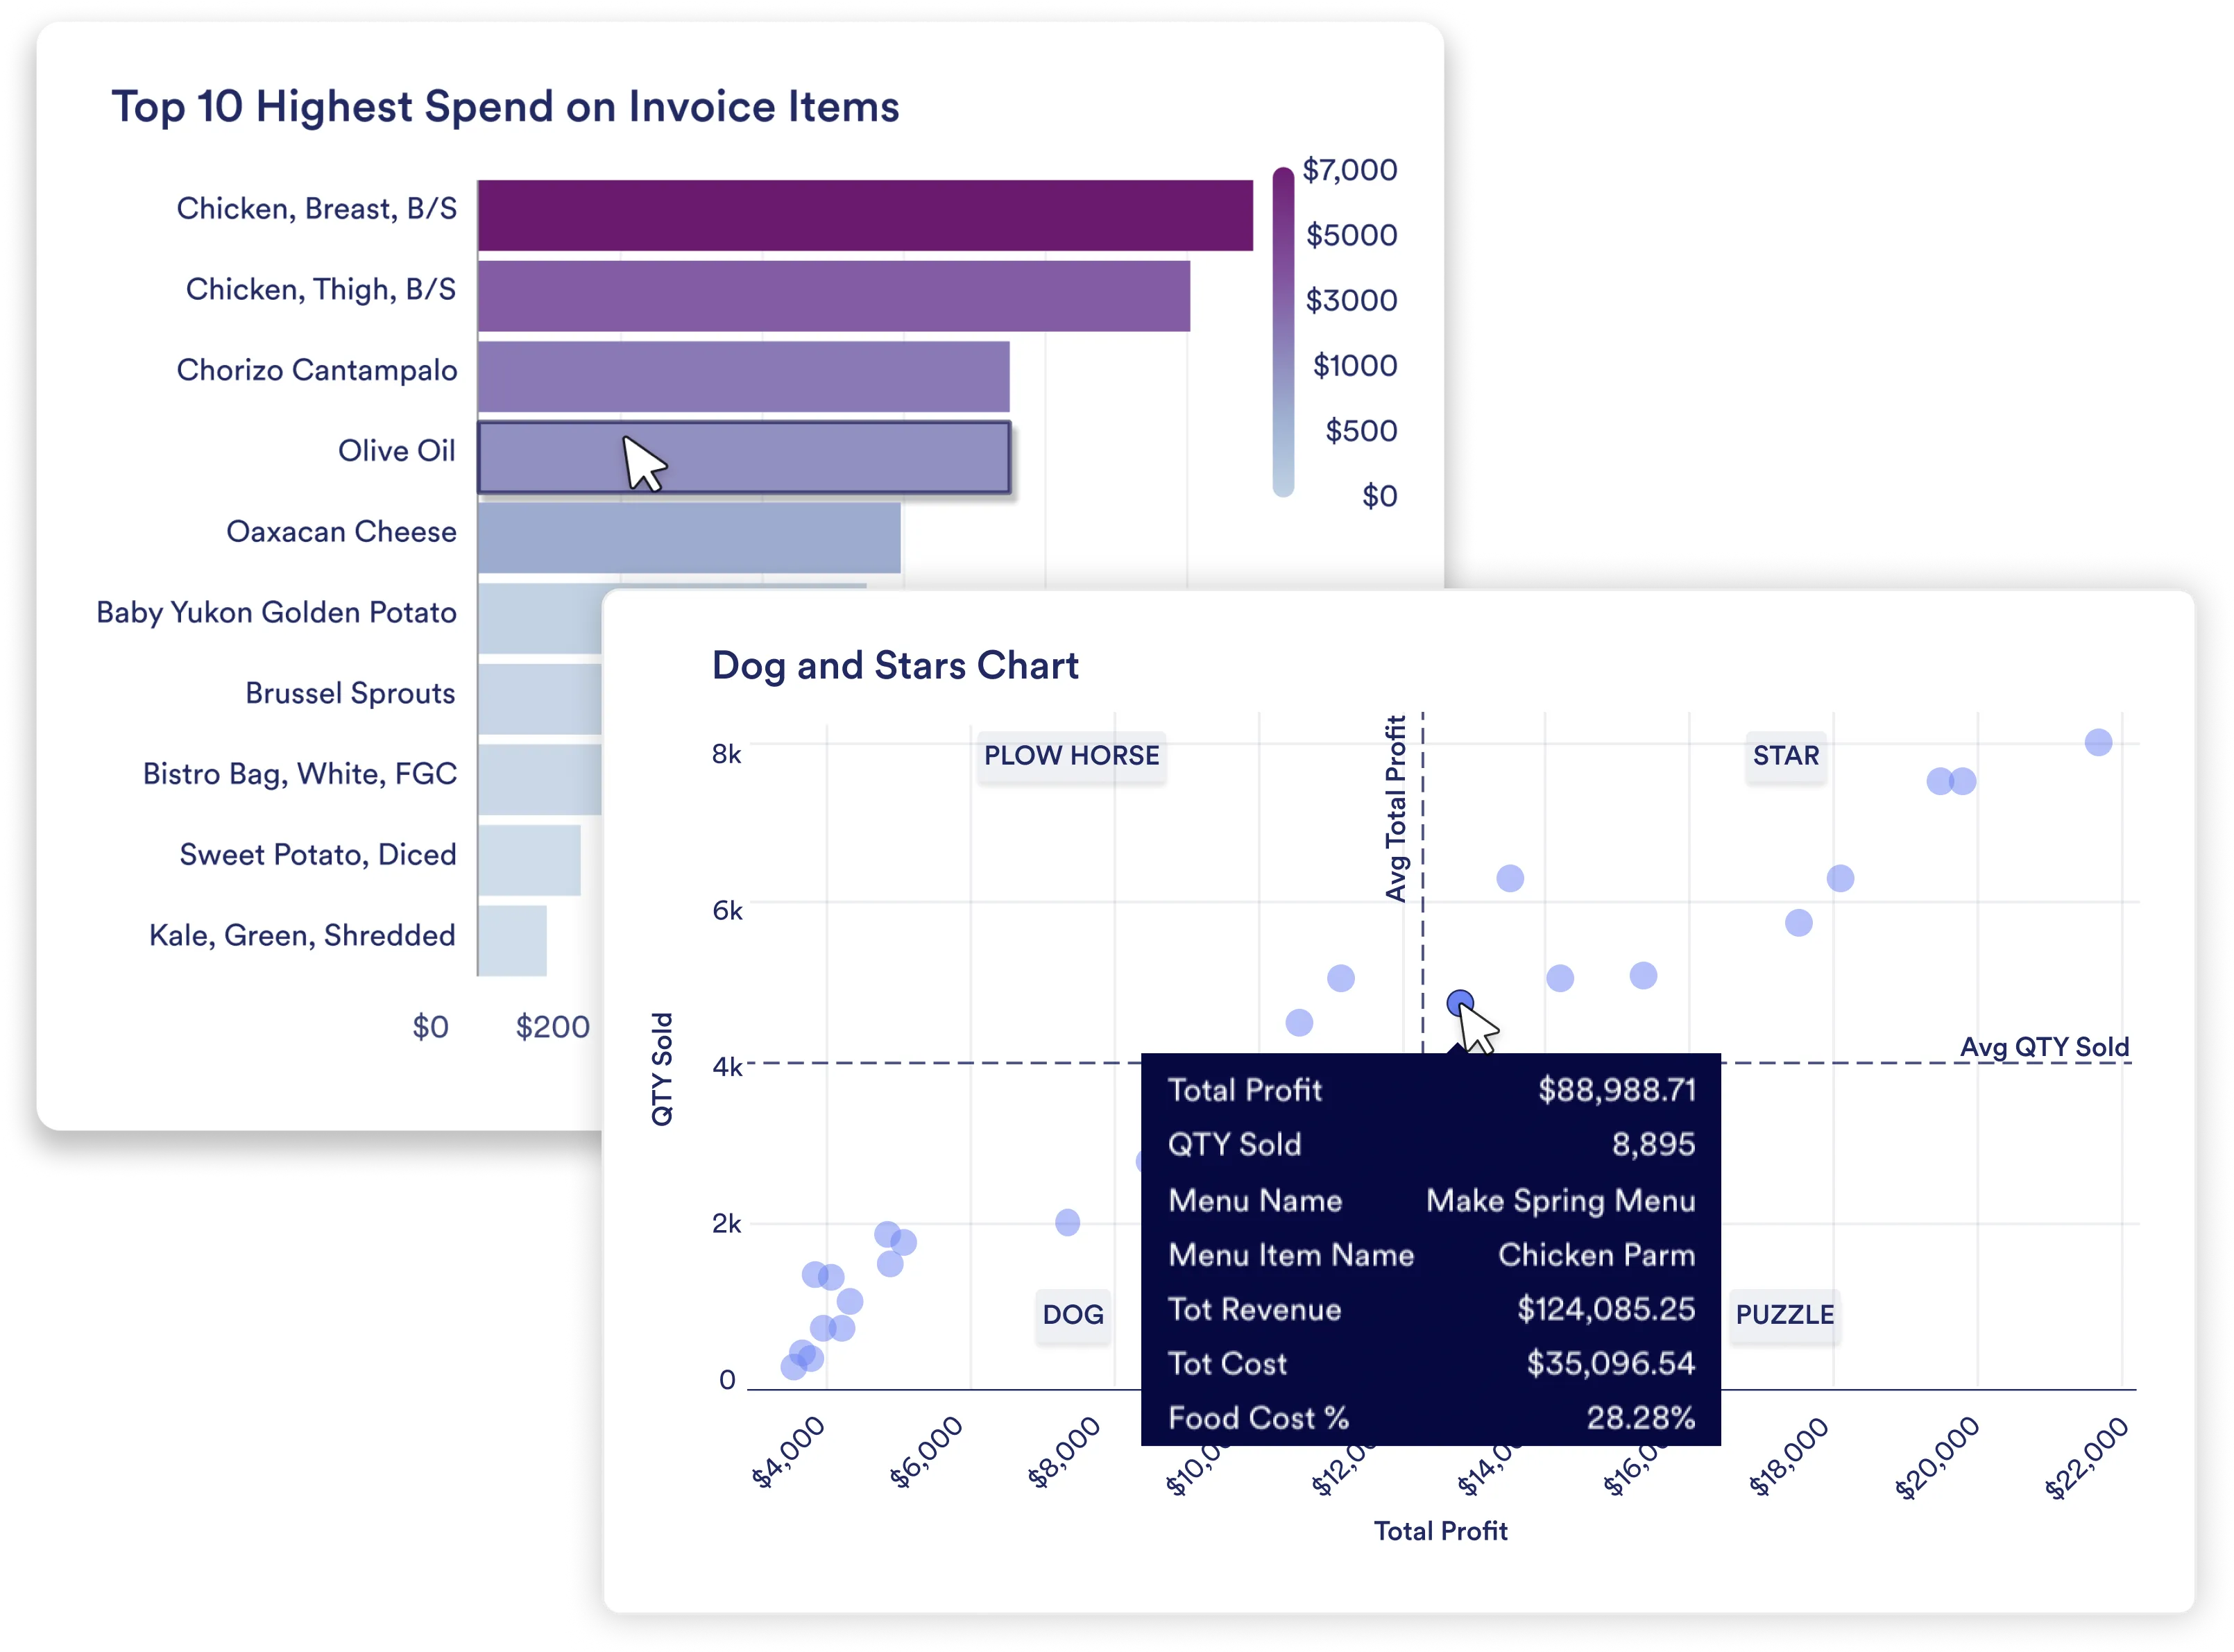
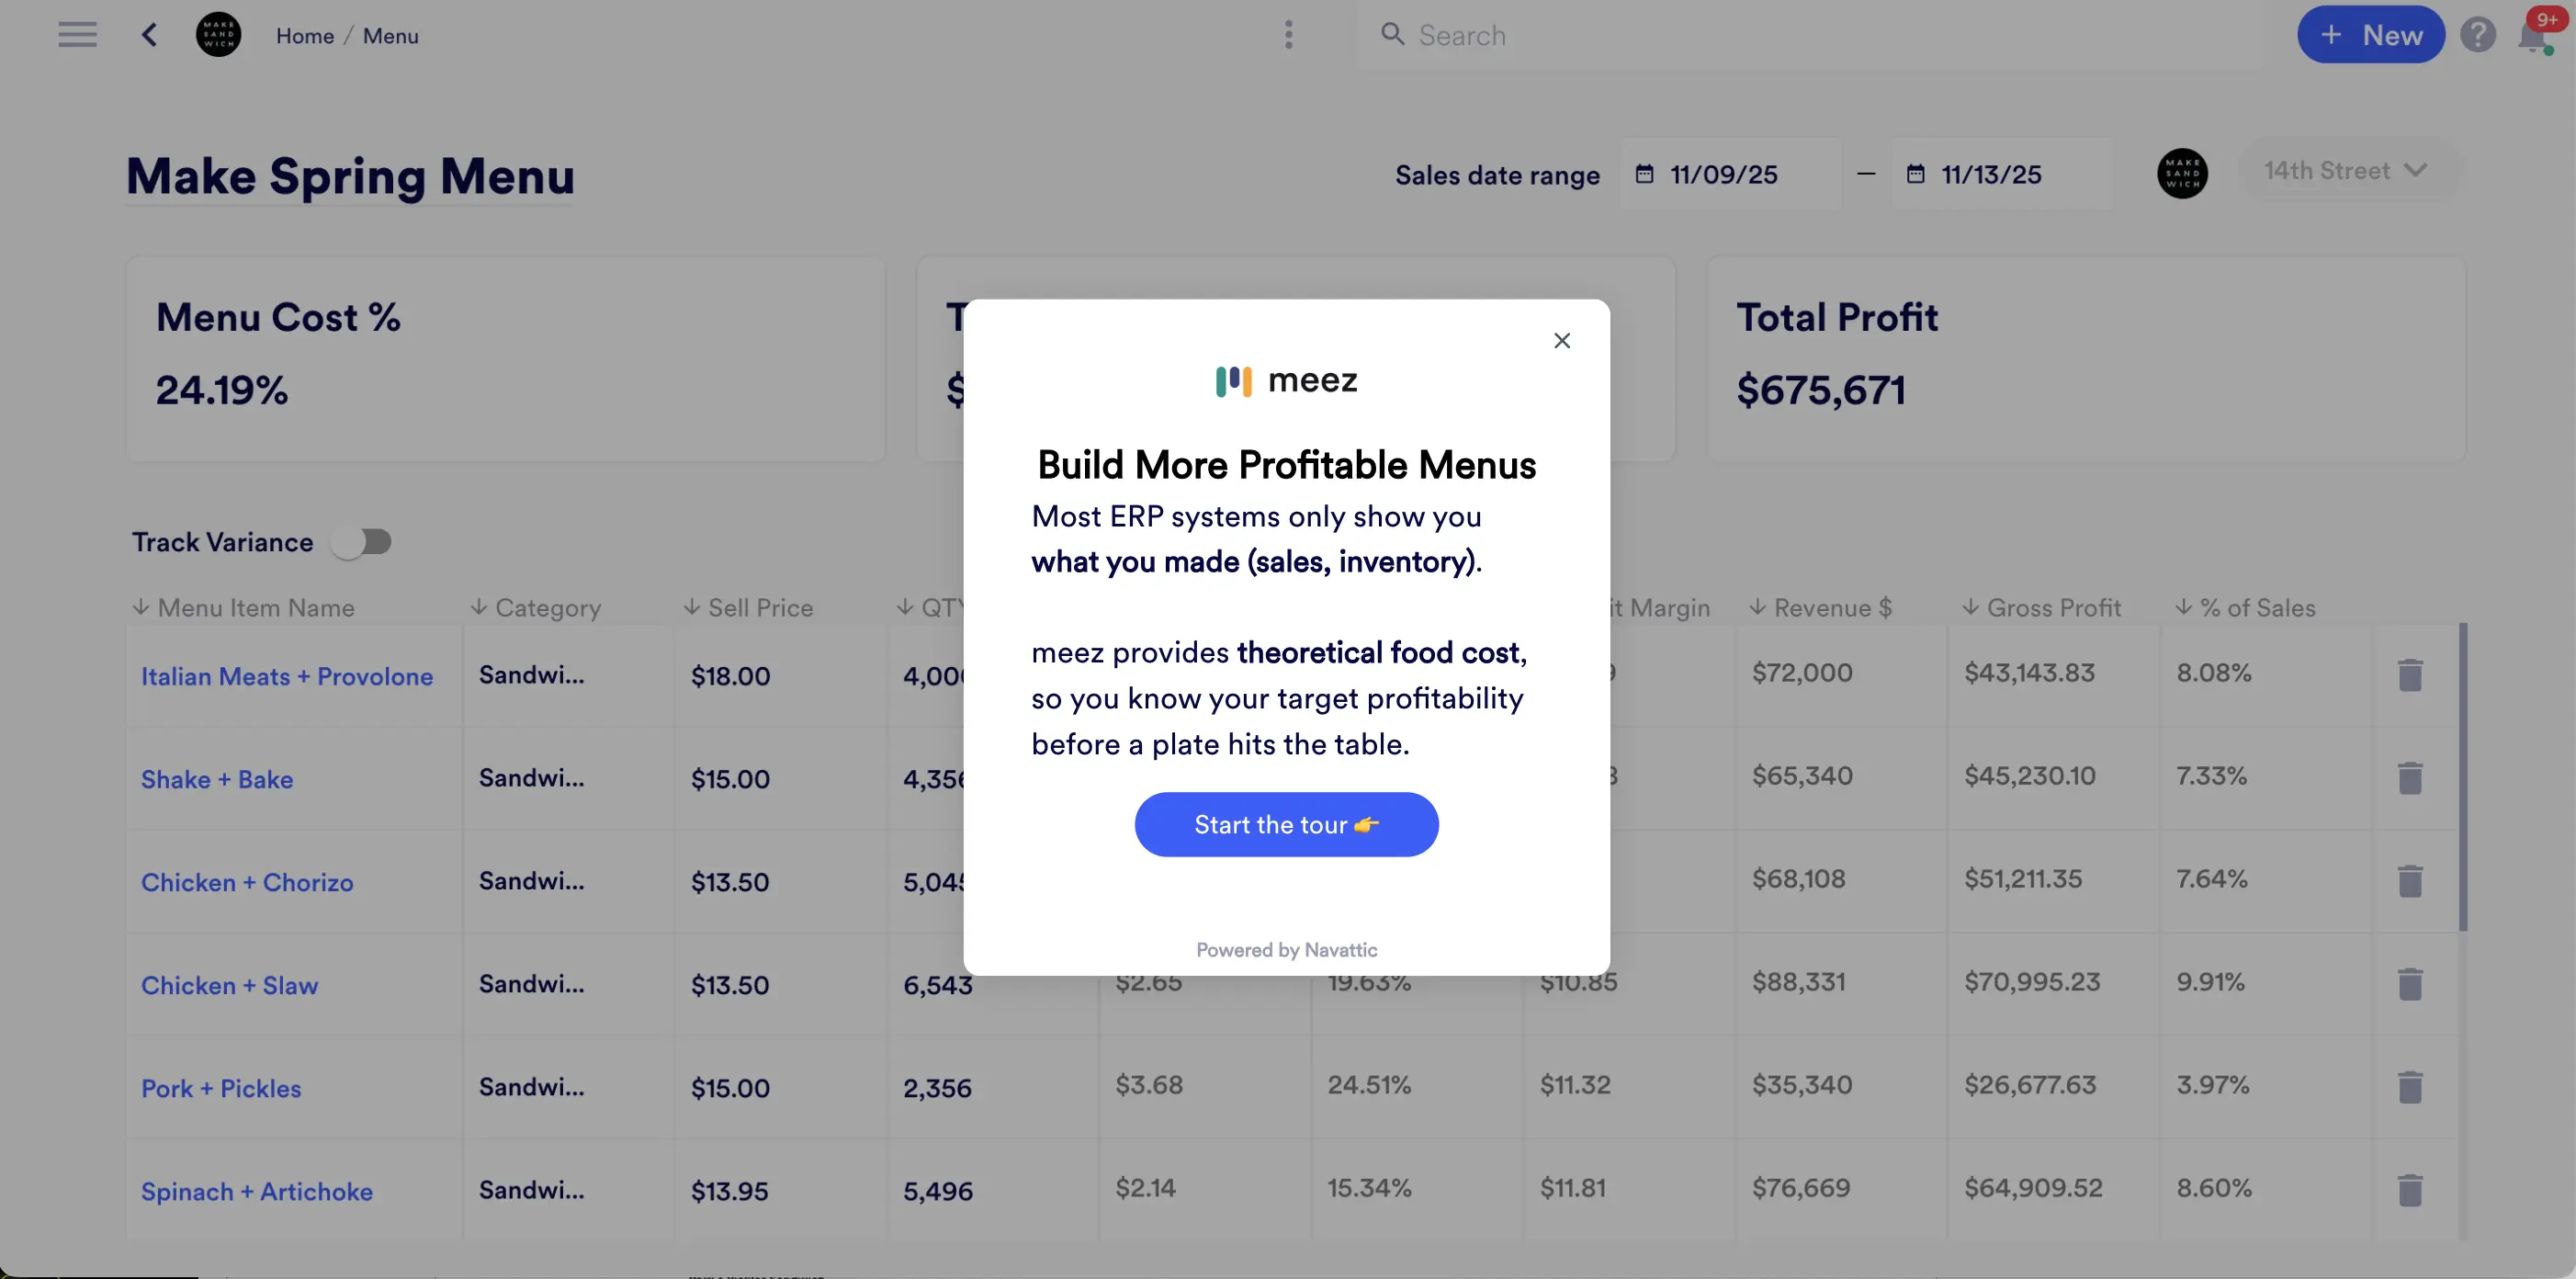
Harness the power of menu analysis with our comprehensive restaurant analytics dashboard. Easily identify areas for improvement using our intuitive charts and graphs.


Our menu analytics dashboard provides valuable purchasing insights, helping you identify and manage costs with ease. The same data that powers your menu analysis feeds directly into purchasing decisions, so you're optimizing your menu and your orders from one place.
A significant portion of your food costs often comes from a small number of key ingredients. Our menu analytics app provides valuable purchasing insights, helping you identify and manage costs with ease to optimize spending.

.png)
Spreadsheets break at scale. They require manual updates and can't account for real prep yields or unit conversions. meez structures your cost data from the start.
Stay ahead of the game with our menu analytics software. Monitor price fluctuations and optimize purchasing to ensure you're always getting the best value.


Benchmark locations against each other. Drill to the recipe level when a number looks off. Even a 1-point food cost improvement across 10 locations can mean hundreds of thousands of dollars recovered annually.
A restaurant analytics dashboard is a centralized view of your operation's financial and culinary performance — showing food cost percentages, recipe contribution margins, and menu performance across locations. Unlike generic BI tools, meez's dashboard connects directly to your recipe data so costs update automatically when ingredient prices change.
POS tracks what's sold; accounting tracks what's spent. A restaurant analytics app like meez sits between them — showing why your food costs are what they are at the recipe level. It answers questions like "which dishes are killing my margins?" that neither your POS nor your accountant can answer.
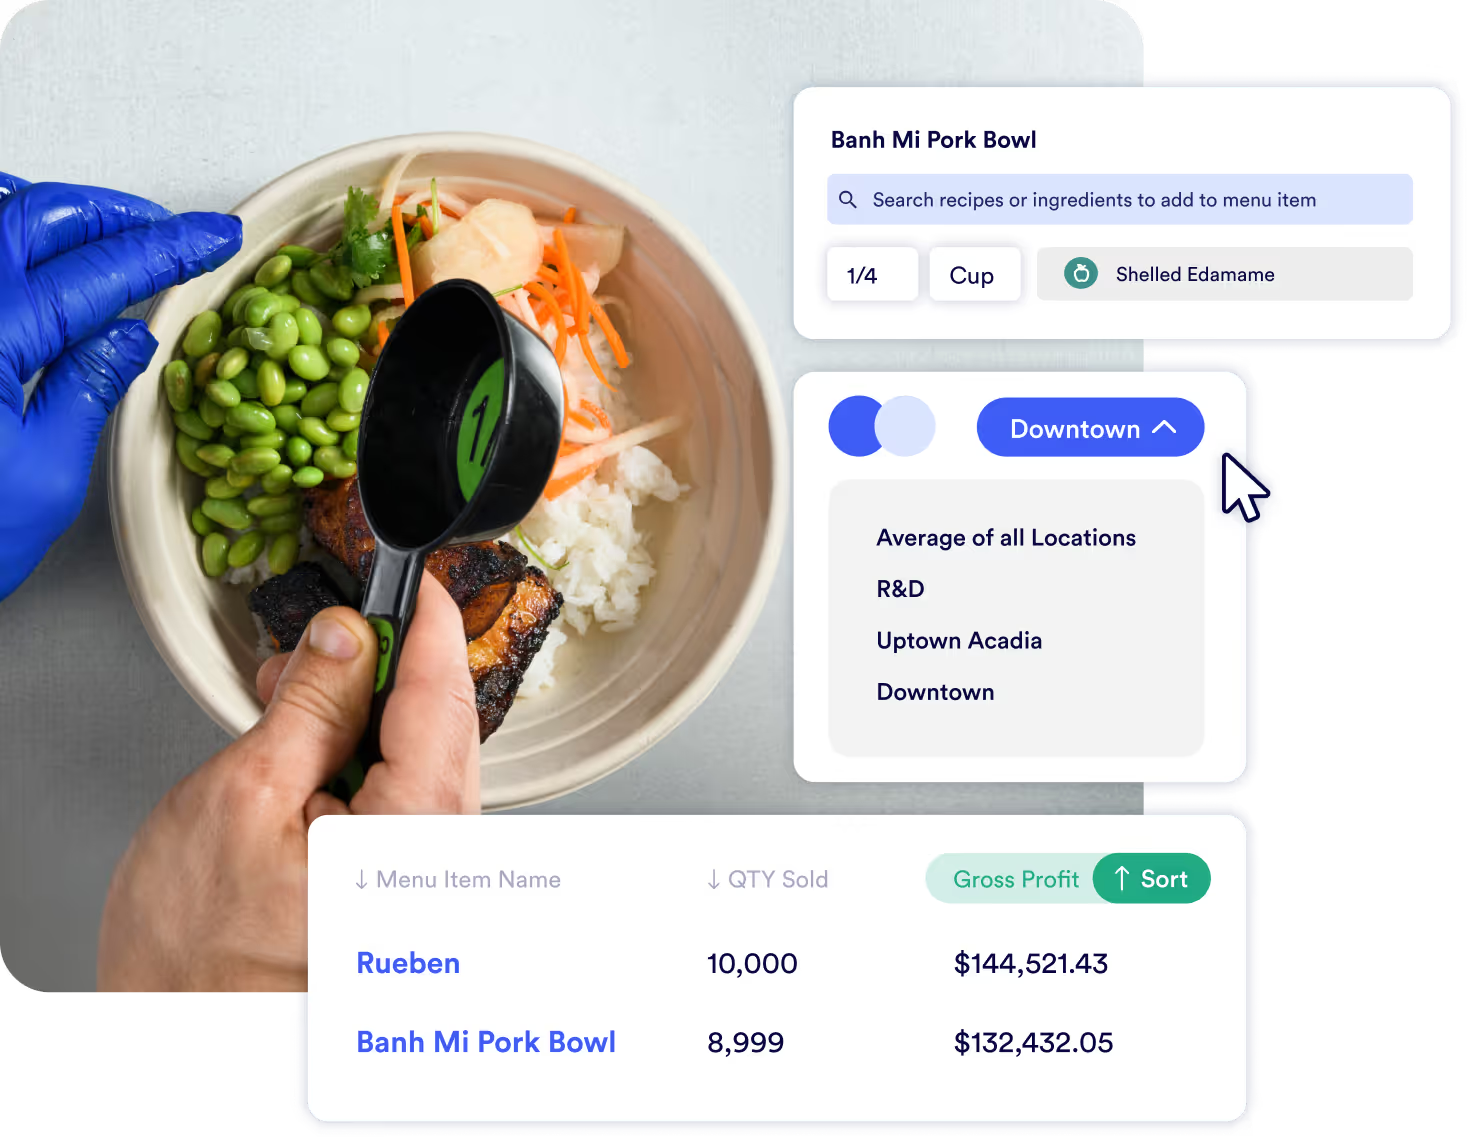
Yes. meez lets you filter performance by location, concept, or time period — so multi-unit operators can benchmark locations against each other, spot outliers, and roll out cost-saving recipe changes across the group.
meez tracks recipe cost, food cost percentage, profit, and cost-per-portion — updated automatically as ingredient prices fluctuate. You can view performance at the recipe level, menu category level, or across your full operation.
Menu analytics is the practice of measuring the performance of each item on your menu, tracking profitability, popularity, and cost contribution across your dish mix. In meez, menu analytics surfaces which items are your highest-margin contributors, which are high-volume but low-margin, and which are underperforming on both dimensions.
Menu analysis assesses each menu item's profitability and popularity to help operators make better pricing, engineering, and procurement decisions. meez's restaurant analytics dashboard performs menu analysis automatically, connecting recipe-level food costs to performance data so you can see the true margin impact of every dish on your menu.
POS systems report on what sold. meez's menu analytics goes deeper — it connects sales mix data to recipe-level food costs and ingredient prices. That means you can see not just which dishes are popular, but which ones are actually making you money after accounting for yields, prep loss, and current ingredient costs.